Badge Program Metrics: What to Track Without Being Creepy
Why badge program metrics matter (and how to keep them respectful)
Badge program metrics are most useful when they answer simple operational questions: Are people getting IDs on time? Are replacements disrupting work? Are certain locations struggling with the process? When measurement stays focused on service quality and program health, it can make workplace and event identification smoother without turning badge usage into surveillance.
The respectful approach is to measure what you need to run the program well—then stop. That usually means aggregated reporting (by site, department, role type, or event day), minimal personal data, and clear communication about what’s tracked and why. Done well, metrics reduce friction for staff, students, volunteers, and attendees because the badge process becomes more predictable and easier to support.
A good rule of thumb: if a metric doesn’t help you improve issuance, replacements, support staffing, or safety checks, it probably doesn’t belong in your reporting.
- Prefer trends over individuals (team/site-level reporting instead of person-level scorekeeping)
- Collect the minimum necessary data (only what’s needed to issue, replace, and audit errors)
- Explain the “why” in plain language (what you track, how long you keep it, who can access it)
- Use metrics to remove bottlenecks, not to create blame
Badge program metrics to start with: the “operations-first” dashboard
If you’re building your first dashboard, start small and make every number earn its place. The most useful badge program metrics map directly to outcomes you can improve: faster issuance, fewer reprints, fewer interruptions, and clearer support needs at the front desk or help desk.
Keep definitions simple so you can compare month to month without reinterpreting what the data means. In most programs, you’ll get plenty of insight by trending counts and rates by location, department, role type, or event day—without scrutinizing individuals.
This kind of aggregated, improvement-focused tracking supports program decisions without being invasive. It’s similar to how many organizations use participation and engagement signals: the value is in group-level patterns and what they reveal about process quality, not in watching any one person. See source for a discussion of using aggregated indicators for program improvement rather than individual surveillance.
- Badges issued (new) per week/month, segmented by site or program
- Badges replaced (total) per week/month, segmented by reason category
- Backlog size (open issuance/replacement requests) by day
- Average time-to-issue for new badges (submission to ready-for-pickup)
- Reprint error rate (reprints due to mistakes vs. legitimate changes)
Usually 5–8 is enough. If you can’t explain how a metric changes a decision (staffing, supplies, templates, training), leave it out until you need it.
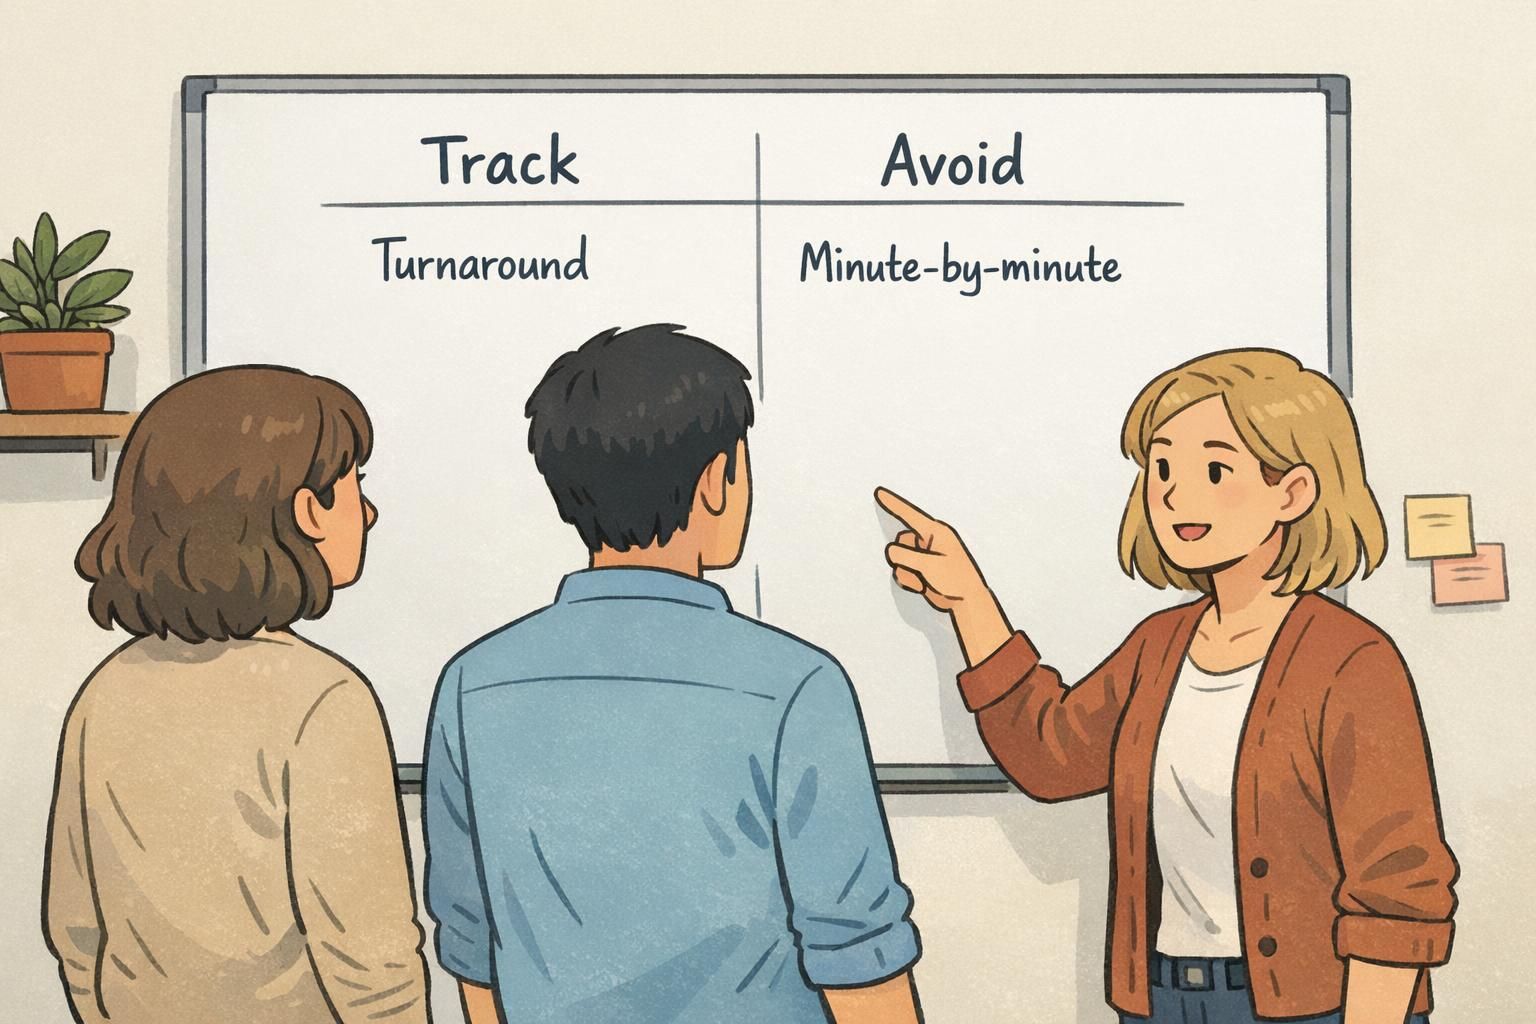
In most cases, no. You’ll get better results (and more trust) by finding process and environment causes—like unclear policies, poor attachment options, or slow turnaround.
ID compliance metrics that don’t rely on constant monitoring
ID compliance matters because it supports quick visual verification, reduces confusion, and helps safety procedures run consistently. But you don’t need always-on tracking to understand whether your program is working. In many workplaces and campuses, periodic, lightweight checks give you enough signal to improve reminders, supplies, and processes.
Instead of trying to log every moment a badge is worn, focus on exceptions and patterns: how often people need temporary solutions, where check-in friction happens, and which sites may benefit from clearer expectations or more comfortable wear options.
- Front desk exception counts (e.g., “forgot badge” incidents) grouped by shift or building
- Supervisor spot checks recorded as team-level totals (sampled, not continuous)
- Help desk/security logs categorized by issue type (forgotten, damaged, expired, unreadable)
- Event check-in exception counts (people needing reprints or category fixes), reported by event day
A privacy-friendly approach to ID compliance is to report results at the team, site, or shift level. That shows where support is needed without creating an individual compliance scoreboard.
Only when there’s a clear role-based need (for example, controlled areas with strict requirements) and governance is in place—defined access controls, documented purpose, and limited retention.
Use sampling and exception tracking. It’s often enough to identify where policies are unclear, accessories aren’t working, or issuance is too slow.
Lost badge rate: how to measure it, what it really tells you, and what to do next
Lost badge rate is one of the highest-value metrics you can track because it connects directly to cost, security risk, and real-world interruptions. When someone loses a badge, it’s rarely just an “oops”—it can mean delayed access, time spent at a help desk, temporary passes, and last-minute printing.
Measure lost badge rate as replacements per 100 active badge holders (or per 1,000 attendees for events) over a defined period. Then segment it by time, location, and wear method. The goal is to spot practical causes you can fix—like clips that pop off easily or lanyards that aren’t comfortable—rather than to single out people.
- Lost badge rate = (Lost-badge replacements ÷ Active badge holders) × 100
- Event lost badge rate = (Lost-badge reprints ÷ Total attendees) × 1,000
- Segment by site/building, department/role type, and month or event day
- Segment by wear method (lanyard, clip, retractable reel) to find what reduces loss
To keep the response improvement-focused, pair the rate with root-cause categories. “Replacement” is not a single story—lost, damaged, name change, role change, and template errors each point to a different fix.
“When we stopped treating replacements as one bucket and started tracking reasons, we realized most ‘loss’ was really ‘damaged holders’ and ‘broken clips.’ Fixing accessories cut disruptions fast.” – Operations Coordinator

Replacement speed and service quality: time-to-reissue, turnaround, and error rate
People feel replacement performance immediately. If a badge is required for entry or role identification, a slow reissue process becomes a daily disruption—for the person who needs the badge and for the staff who have to improvise.
Track experience metrics that reflect service quality without needing granular behavior data. Good options include average time-to-reissue, percent replaced same-day, and reprints due to errors like wrong name, title, photo, or expiration. These numbers help you identify where the workflow breaks: intake, approvals, printing, pickup, or data quality.
- Average time-to-reissue (request submitted to badge ready)
- Percent of replacements completed same-day (or within one business day)
- Error-driven reprint rate (wrong name/title/photo/expiration/template) as a percentage of total prints
- Requests by intake channel (HR, security, front desk, event registration) to spot friction
- Peak times for replacement requests to plan staffing and printer capacity
Privacy tip: keep only the data needed to fulfill the request and audit issues, then minimize retention. Service-quality reporting can usually be done from ticket timestamps and categorized reasons without storing detailed histories.
If you’re choosing program supplies to support faster replacements, standardizing card and holder formats can reduce “compatibility surprises” at pickup. For example, keeping consistent hole punches (single-hole or double-hole) and a default attachment style makes it easier to stock spares and hand someone a ready-to-wear replacement.
What not to track: common “creepy” metrics and safer alternatives
Badge systems can generate data that feels tempting to analyze: scans, doors, timestamps, and movement patterns. But many of these signals are weakly related to the outcomes most programs actually need—smooth issuance, reliable identification, and fewer disruptions—and they can erode trust even when intentions are good.
A simple test: would a reasonable badge holder be surprised to learn you’re collecting this? If yes, either don’t collect it, or redesign the metric so it’s aggregated, sampled, and purpose-limited.
- Avoid: minute-by-minute location histories tied to individuals | Safer: anonymized, short-term door diagnostics during a known issue window
- Avoid: individual “productivity scores” derived from access or scan activity | Safer: team-level service metrics (turnaround times, backlog, error rates)
- Avoid: public leaderboards for “best” or “worst” badge behavior | Safer: opt-in recognition or team-based progress toward shared goals
- Avoid: click-by-click timelines across systems | Safer: aggregated counts of exceptions and process delays by site or shift
Privacy-first measurement: transparency, minimization, access controls, and retention
The strongest privacy programs are concrete. They don’t rely on vague assurances; they rely on written purposes, minimal data collection, controlled access, and clear retention limits. This helps badge holders feel respected and helps administrators defend the program when questions come up.
Start by writing down the purpose of each metric in one sentence. If you can’t state the purpose plainly, it’s a sign the metric may be drifting toward “because we can” collection. Then align collection and reporting to that purpose—typically by aggregating results and limiting who can see any person-level details.
- Purpose: Document why each metric exists and what decision it supports
- Minimization: Collect only what’s needed to issue, replace, and audit errors
- Access controls: Limit individual-level data to staff who process issuance/security exceptions
- Retention: Set time windows (e.g., keep replacement tickets for a limited period) and follow them
- Export rules: Document who can export reports and how exports are stored
- Visibility: When possible, let badge holders review their own record for accuracy
“Trust improved when we explained our metrics in plain language: we track replacement volume and turnaround so we can staff the desk and keep people moving—not to watch where anyone goes.” – HR Lead

Design and process improvements that naturally reduce loss and reprints
Metrics become valuable when they point to fixes you can actually implement. If your lost badge rate is higher in one site, you might discover people there prefer a clip over a lanyard due to job tasks—so offering the right attachment can reduce loss. If reprint errors are high, you might need clearer templates, better intake checks, or more consistent photo standards.
Standardizing layouts can also reduce front-desk confusion. When names are consistently prominent, role or department fields are predictable, and expiration cues are easy to spot, staff can verify IDs faster without needing extra checks or secondary systems.
- Durability upgrades where damage-related replacements are common (materials, holders, attachment quality)
- Clear photo standards to reduce “unusable photo” reprints (lighting, background, framing)
- Template standardization so key fields appear in consistent locations
- Wear-method options to fit different roles (lanyard vs. clip vs. reel), based on replacement and loss patterns
- Simplified reprint steps: clear intake form, defined approvals, and a consistent pickup process
- Event improvements: clearer category color-coding to reduce misroutes and reprint demands
If a fix reduces loss or reprints, it often improves both privacy and operations: fewer exceptions means less personal data moving through urgent, ad hoc processes.
Putting it into practice: a simple monthly scorecard and the right supplies
A monthly scorecard keeps your badge program metrics actionable without turning reporting into a full-time job. Keep it short, trend-based, and segmented by site or program—so you can see where to improve support, templates, or accessories.
- Badge volume issued (new) by site/program
- Lost badge rate by site/program and month
- Replacement turnaround time (average and percent same-day)
- Reprint error rate (mistakes vs. legitimate changes)
- Exception counts tied to ID compliance (forgot-badge incidents, temporary pass issuance) by building/shift
If you’re refreshing or standardizing your program, it can help to choose a consistent badge format so replacements are fast and predictable. For example, when your organization uses the same style of photo ID across teams, it’s easier to keep blanks, holders, and printing steps consistent—and easier for staff to recognize IDs at a glance.
When you’re ready to update your badge stock, you can review options like custom photo ID badges as part of building a smoother replacement workflow.
Report at the site/team level, focus on service outcomes (turnaround, error rate, exception counts), and publish a clear explanation of what’s tracked and what isn’t.
Treat it as a starting point for investigation: compare wear methods, workload, staffing coverage, and intake quality. Often the fix is process or supply-related, not behavioral.